La publication d'août des perspectives à long terme de la NOAA apporte une prévision mise à jour de l'hiver 2025-26 pour les températures et les précipitations à travers les régions de montagne du pays. Alors que les prédictions de juillet ont fait allusion à l'évolution des conditions ENSO et à une signature classique de La Niña, les nouvelles données d'août montrent des changements régionaux notables dans les chutes de neige projetées, les modèles de froid et les probabilités météorologiques globales.
Vous trouverez ci-dessous une ventilation des changements clés et des perspectives détaillées par région et de ce que l'hiver 2025-26 peut apporter aux skieurs et aux cyclistes, suivi de la discussion complète en bas.
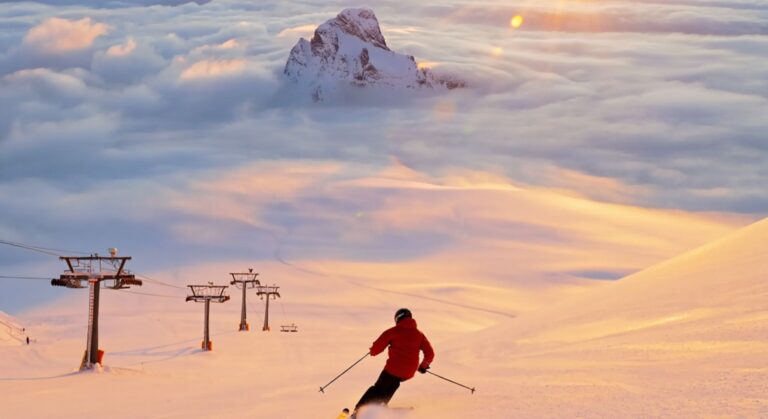
Tl; dr pour skieurs et snowboarders
Faits saillants nationaux
Perspectives régionales
Pacifique Nord-Ouest (WA, OR, ID, Northern CA)
Température:
Précipitations / neige:
Northern Rockies (MT, WY, Northern Co, ID)
Température:
Précipitations / neige:
Sierra Nevada & Southwest (CA, NV, UT, AZ, Southern Co, NM)
Température:
Précipitations / neige:
Nord-Est et Nouvelle-Angleterre (ME, NH, VT, MA, NY)
Température:
Précipitations / neige:
Colorado Rockies & Four Corners (CO, UT, NM, AZ)
Température:
Précipitations / neige:
Alaska
Température:
Précipitations / neige:
Changements importants par rapport aux perspectives de juillet
Sur la base des cartes de perspectives saisonnières de l'hiver de la NOAA 2025-26 pour les précipitations et la température, voici cinq stations de ski susceptibles de voir la neige la plus supérieure à la moyenne, et cinq stations susceptibles de ressentir des conditions plus sèches que la moyenne, par rapport à la normale:
Les stations susceptibles de voir la neige la plus supérieure à la moyenne
1. Big Sky Resort, Montana
2. Whitefish Mountain Resort, Montana
3. Schweitzer, Idaho
4. Jackson Hole Mountain Resort, Wyoming
5. Boyne Mountain, Michigan
Les stations susceptibles d'être les plus sèches
1. Taos Ski Valley, Nouveau-Mexique
2. Arizona Snowbowl, Arizona
3. Wolf Creek, Colorado
4. Mammoth Mountain, Californie
5. Mount Bachelor, Oregon
Restez à l'écoute pour la prochaine série de mises à jour NOAA à mesure que la dynamique ENSO et les prédicteurs globaux évoluent. Les perspectives d'août 2025 marquent une évolution vers les influences «classiques» de La Niña, en particulier pour les montagnes du nord et de l'ouest, alors planifiez ces voyages et poursuivez la poudre où les chances sont les mieux.
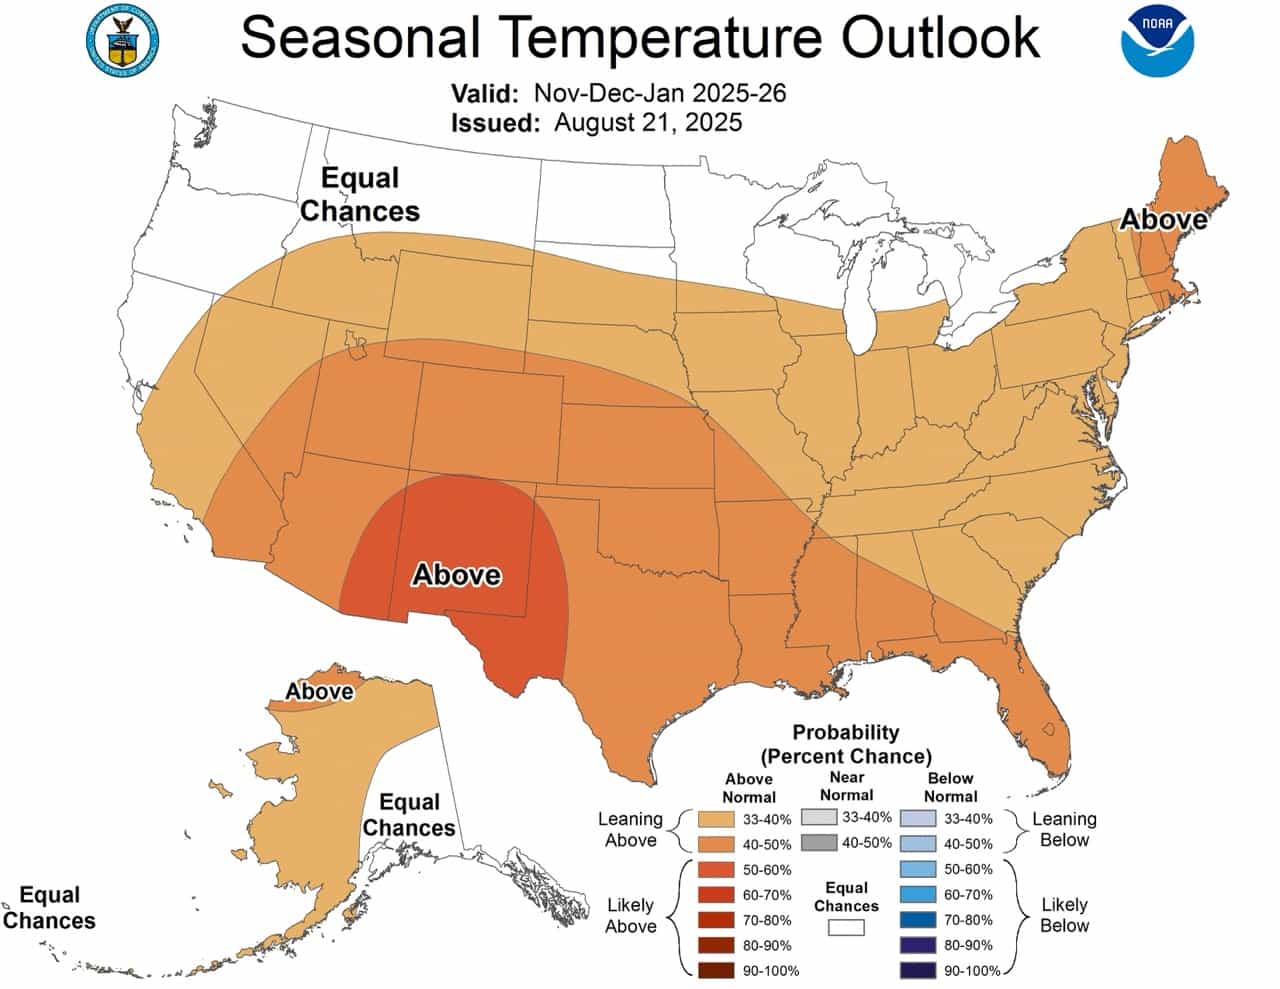
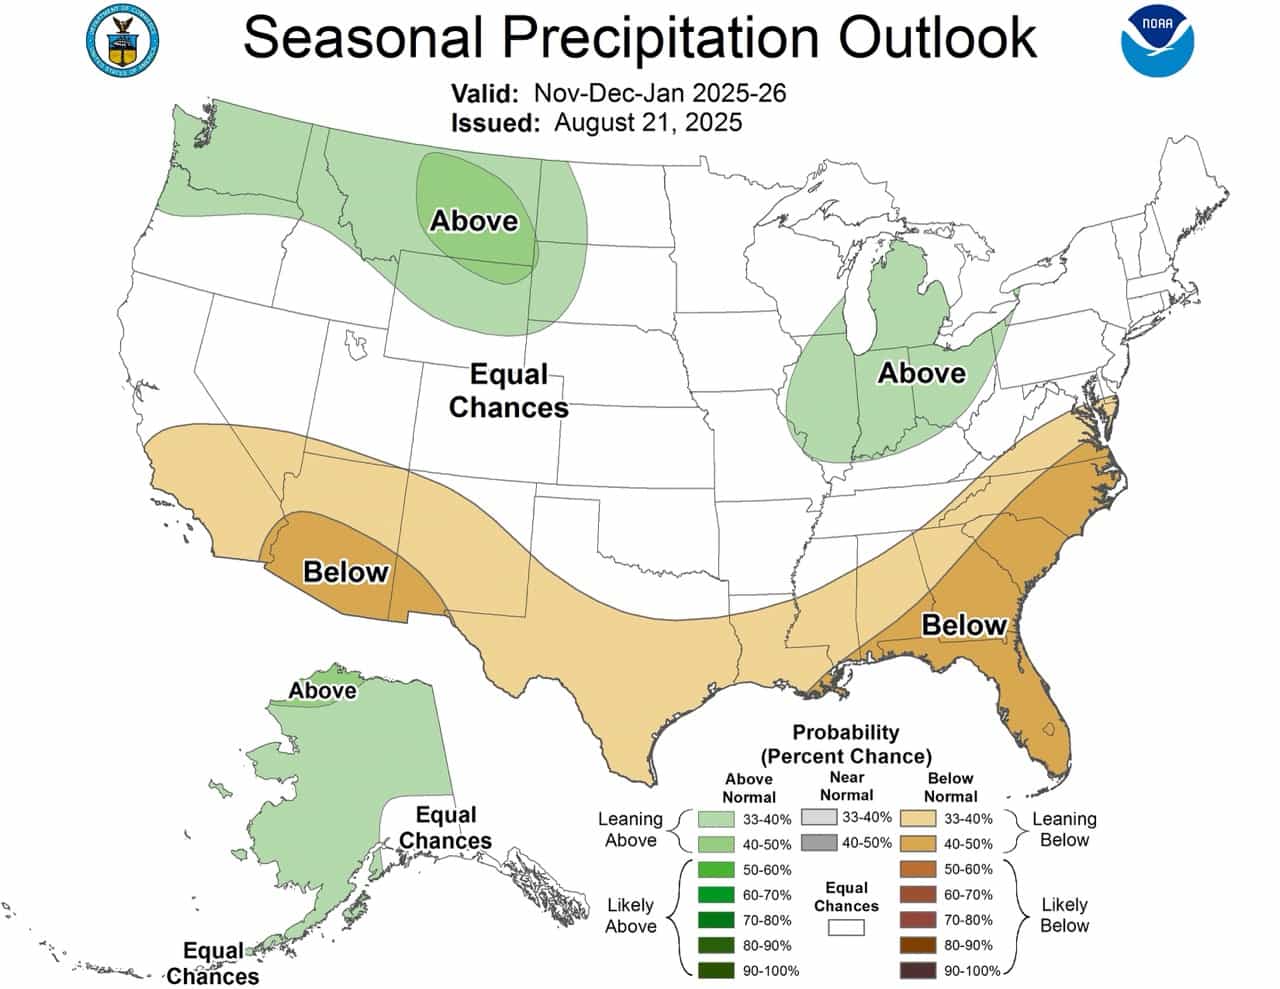
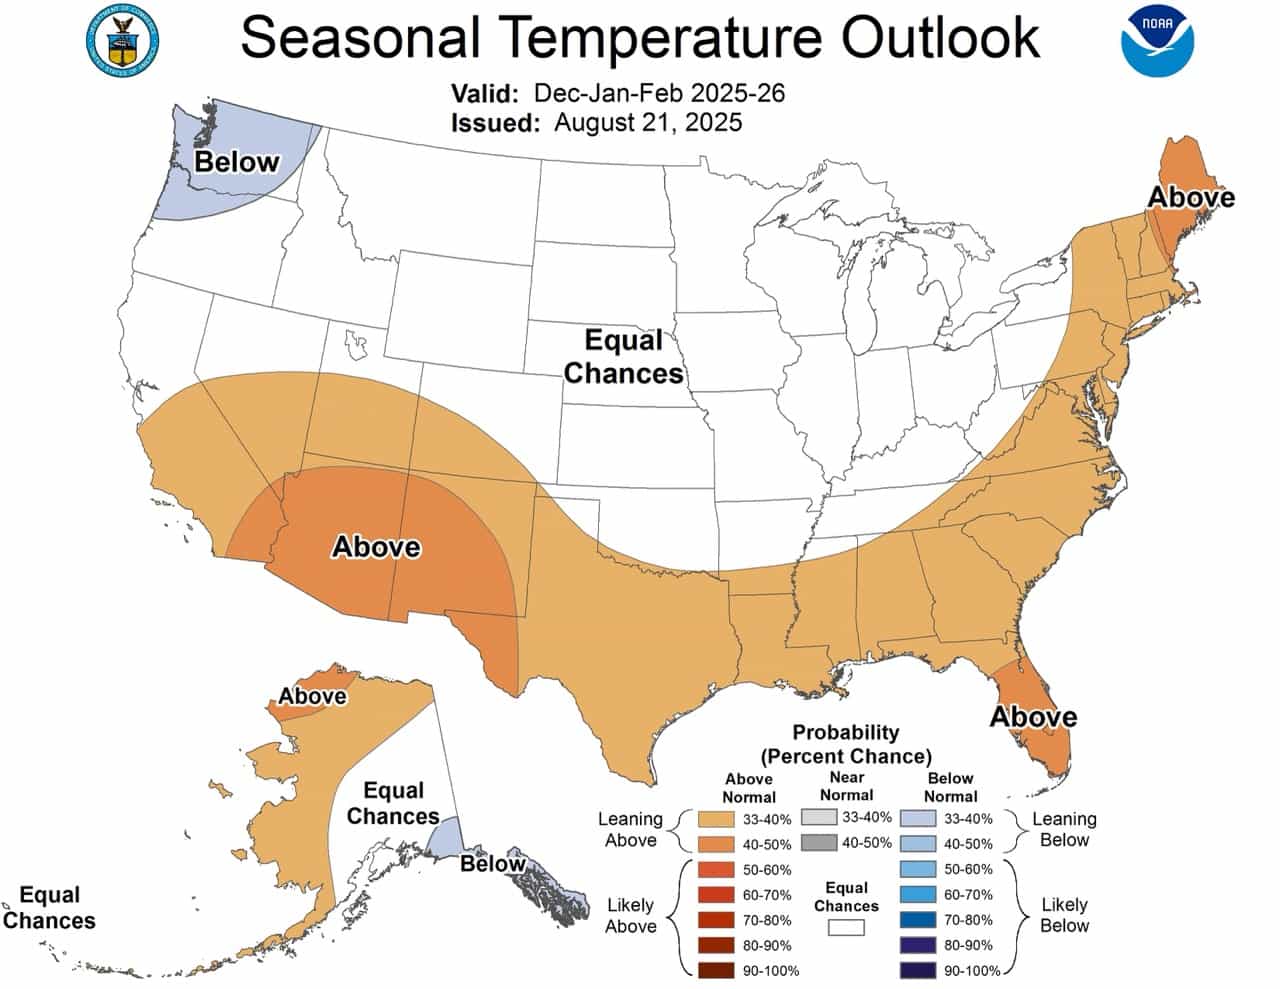
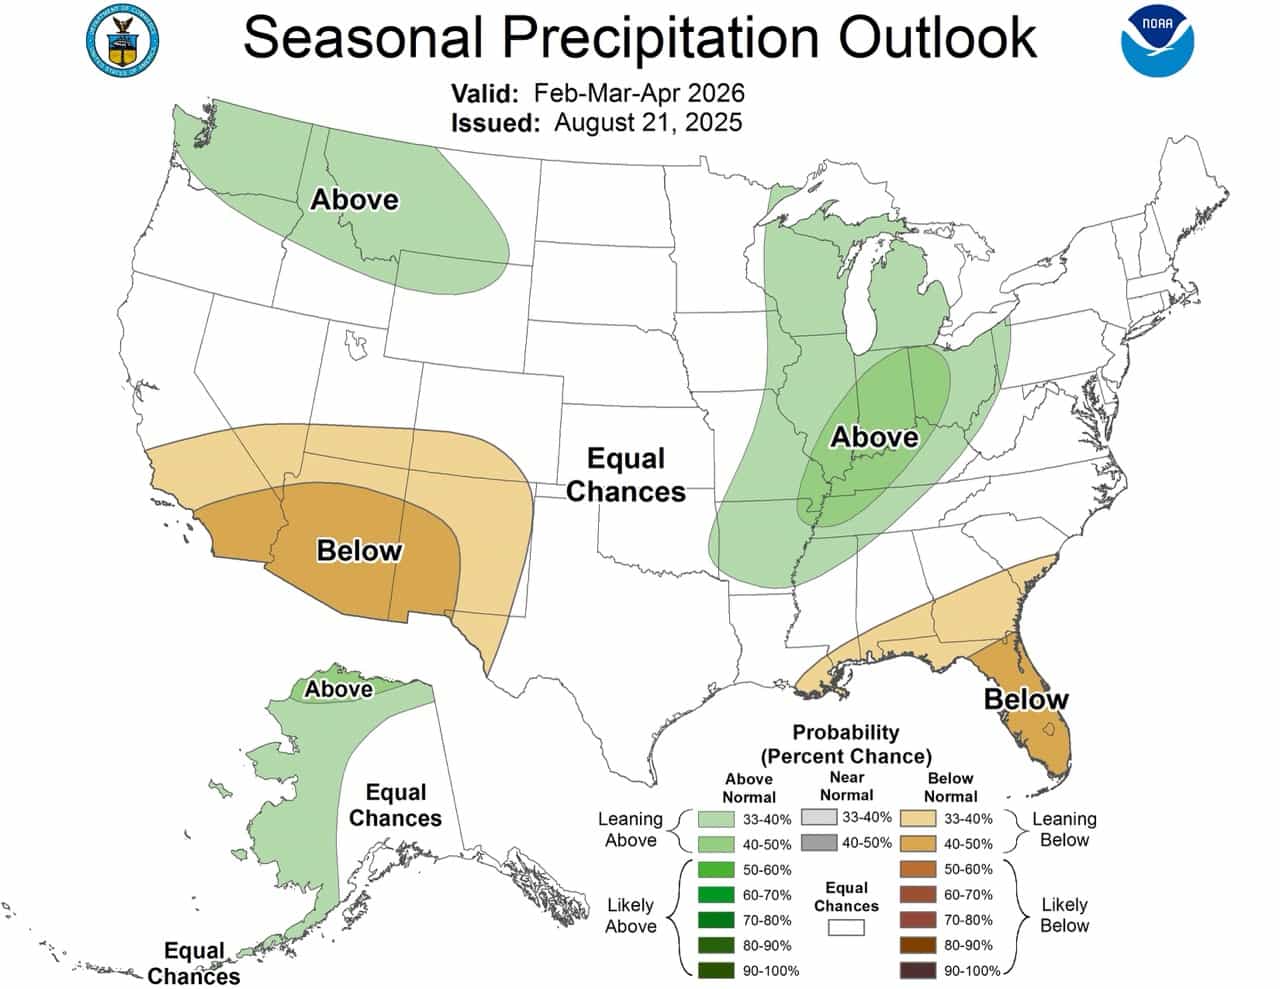
Maps Outlook pour les prévisions de la NOAA hiver 2025-26
Discussion complète
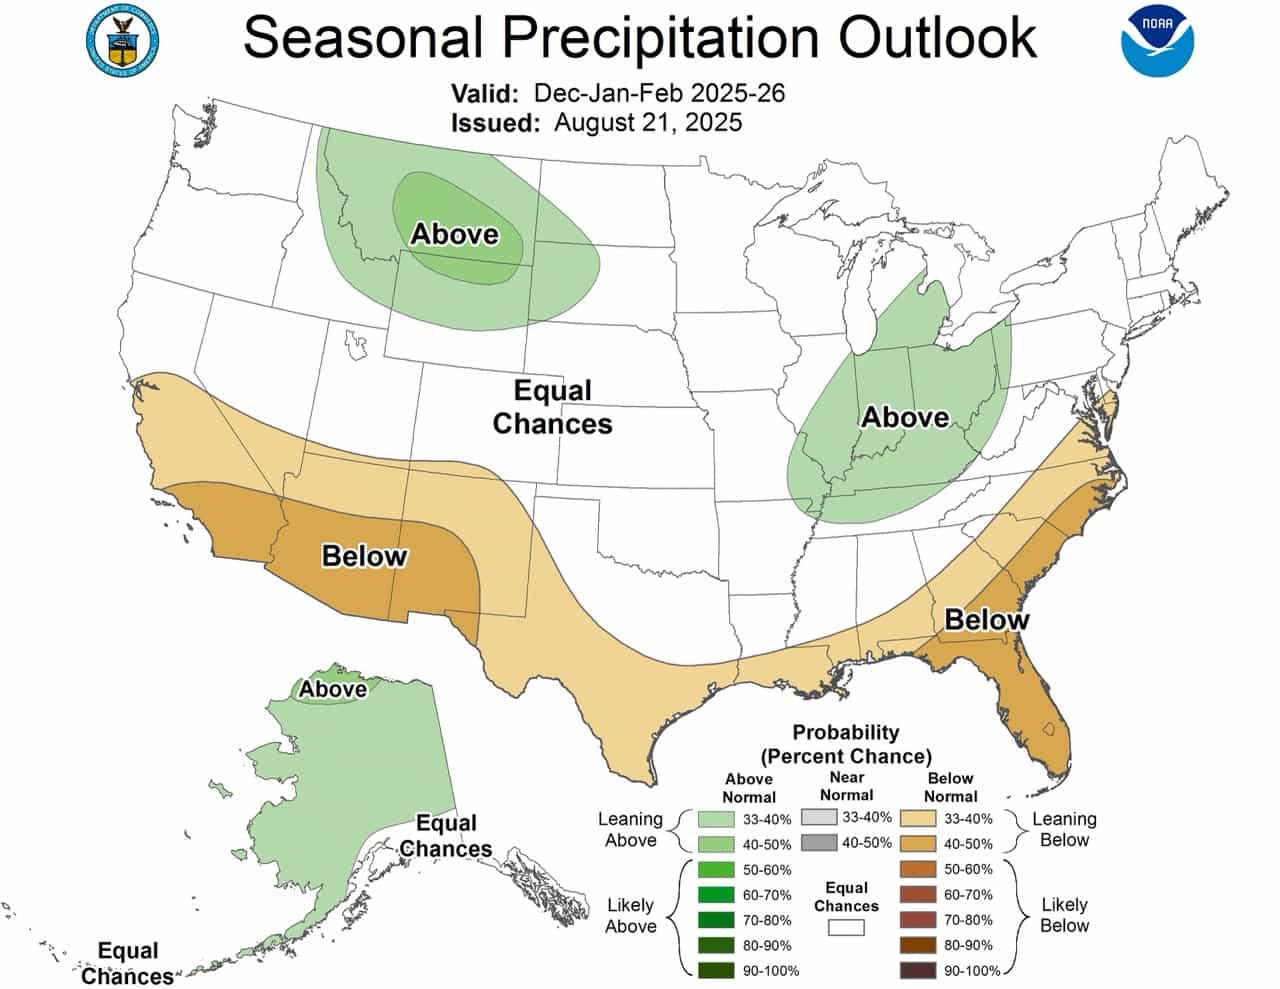
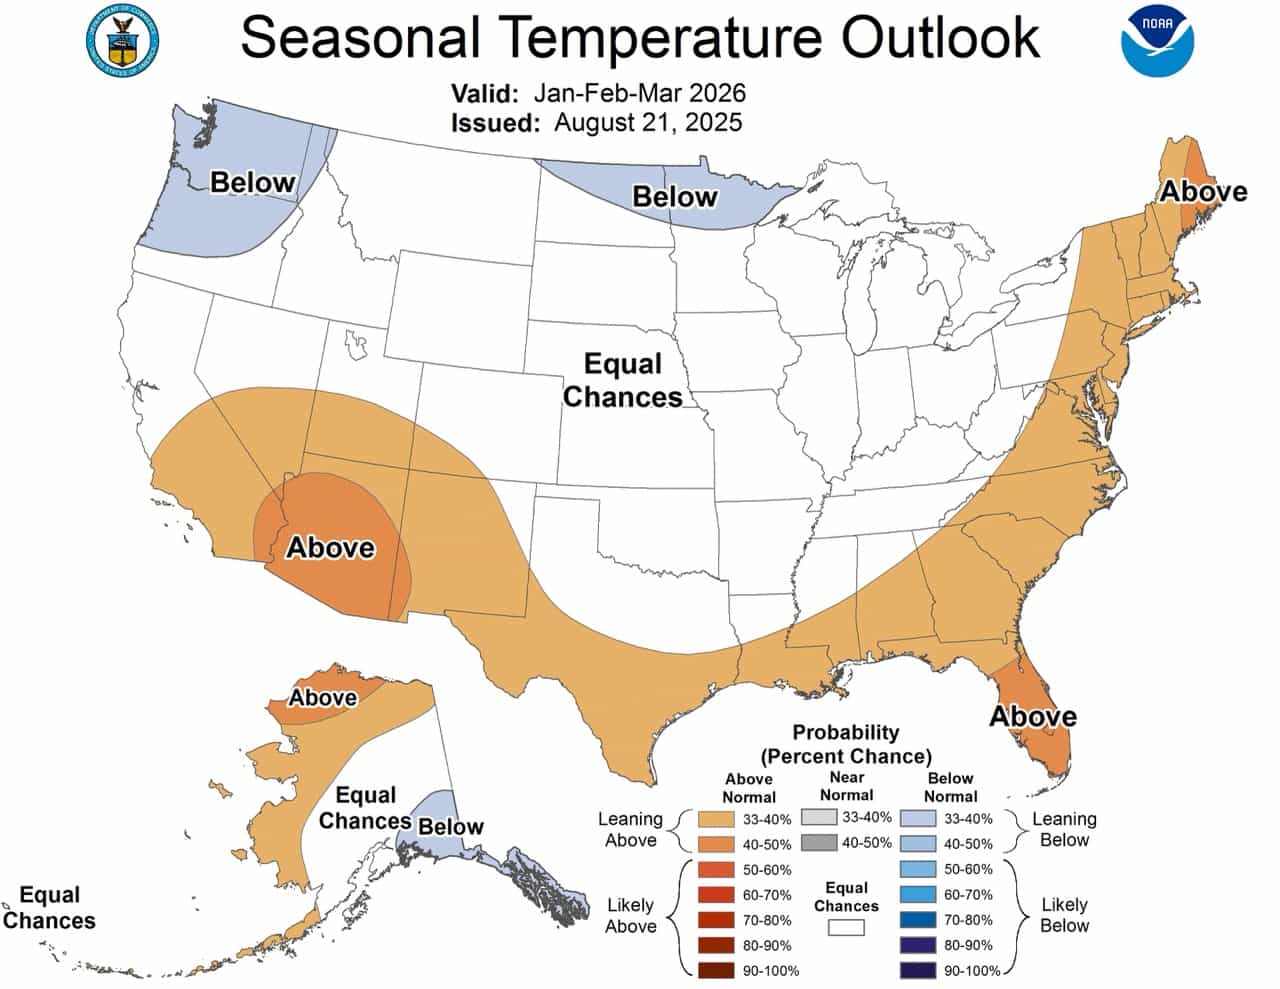
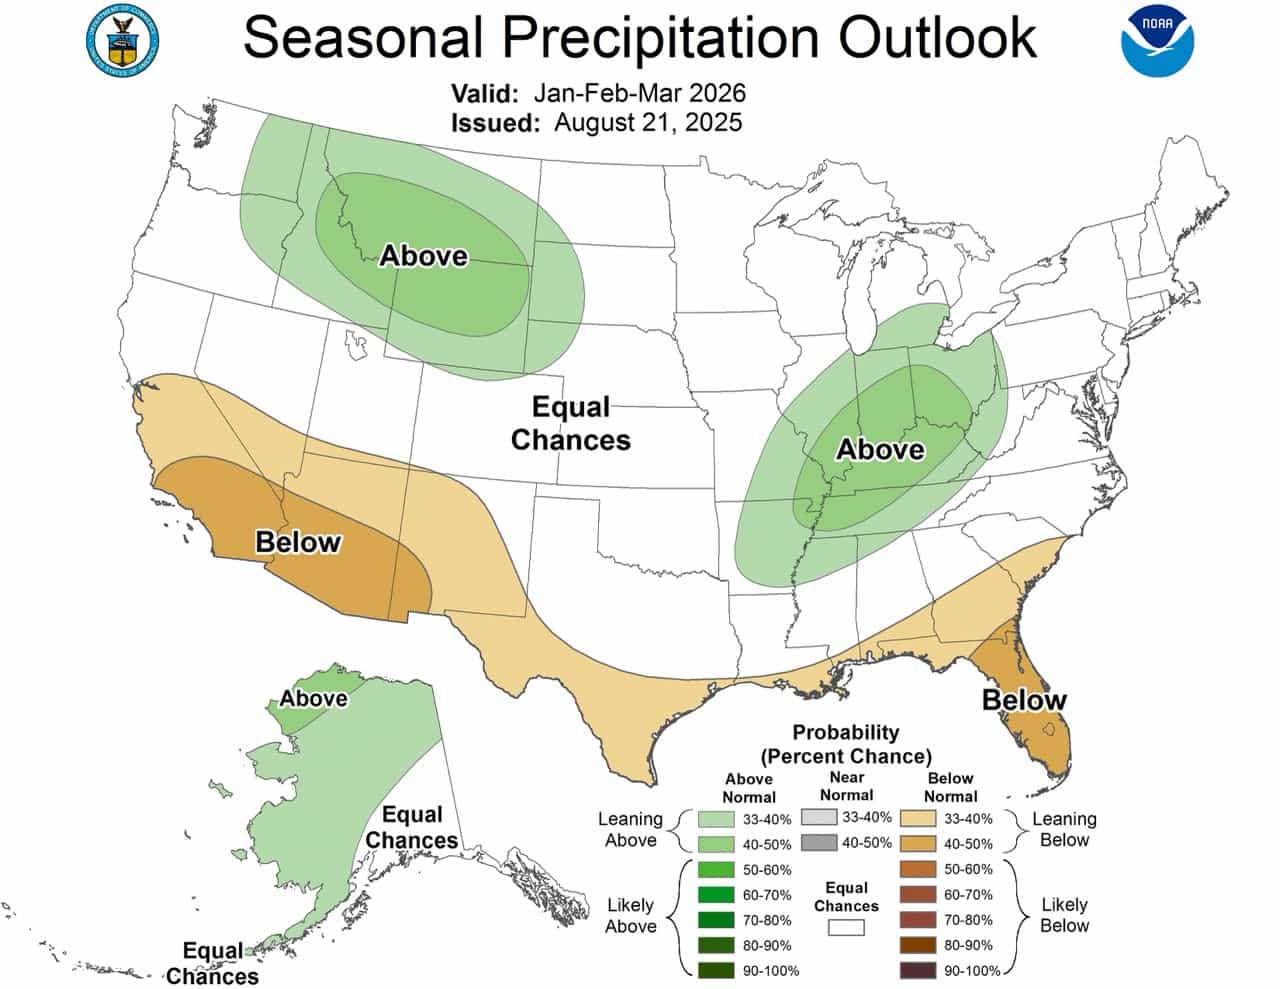
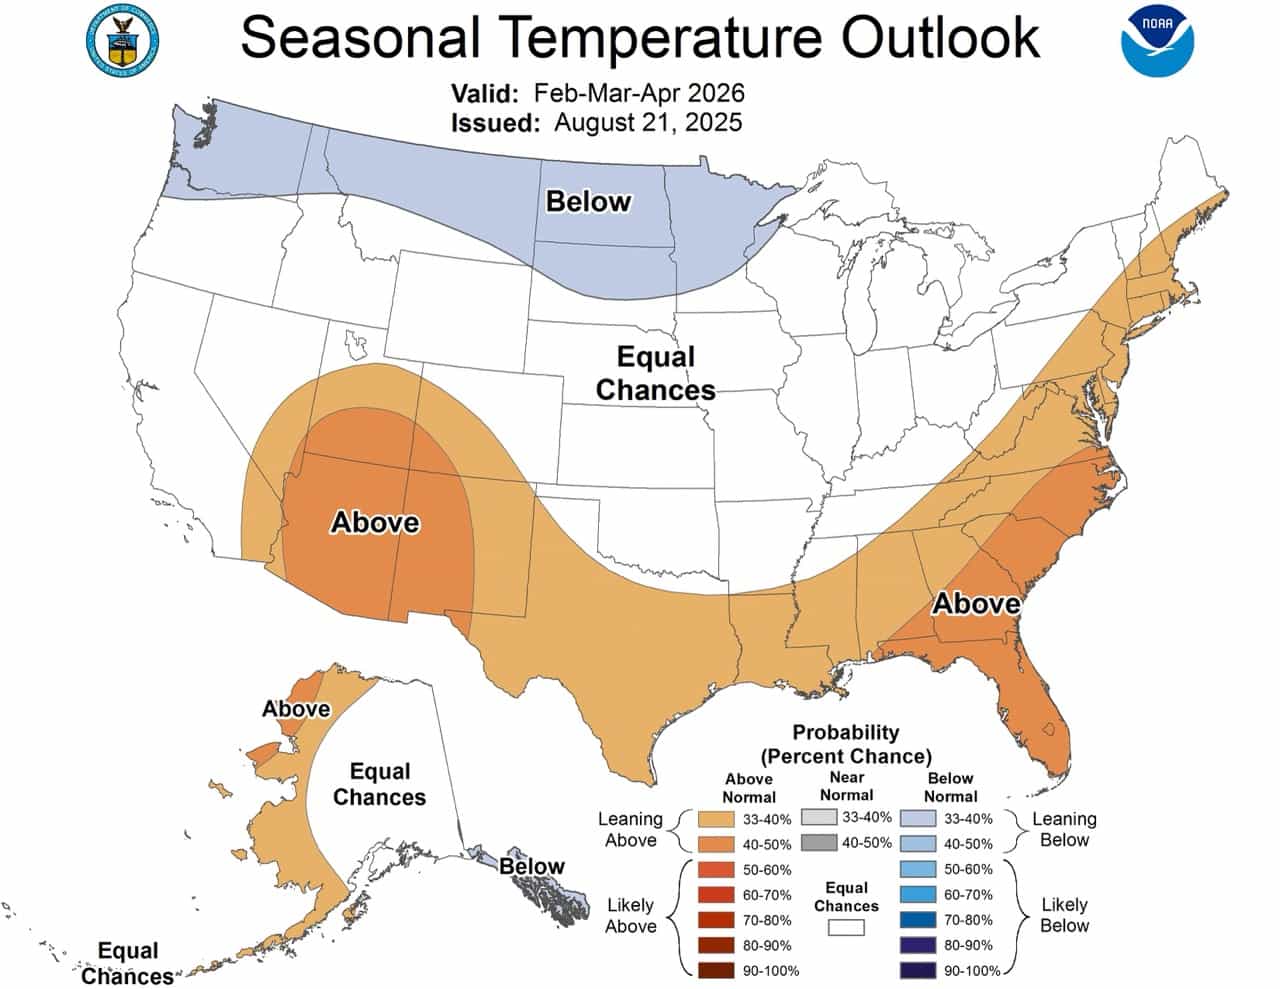
Prognostic Discussion for Long-Lead Seasonal Outlooks
NWS Climate Prediction Center College Park MD
830 AM EDT Thu Aug 21 2025

SUMMARY OF THE OUTLOOK FOR NON-TECHNICAL USERS

El Niño Southern Oscillation (ENSO)-neutral conditions are present, with sea
surface temperatures (SSTs) near average across most of the tropical Pacific
Ocean. The ENSO Alert System Status has been updated to a La Niña Watch, which
is issued when conditions are favorable for the development of La Niña within
the next 6 months. ENSO-neutral considerations are most likely through the end
of summer and into early fall 2025, followed by a brief period of favored La
Niña conditions in the fall and early winter 2025-2026, before returning to
ENSO-neutral conditions in late winter and early spring 2026. The chances of El
Niño are very small through early spring 2026.

The September-October-November (SON) 2025 Outlook favors above-normal
temperatures over the majority of the contiguous United States (CONUS) and
Alaska. The highest probabilities, reaching a 60 to 70 percent chance of
above-normal temperatures, are over the eastern tip of the CONUS, Southwest,
and Central Great Basin. Equal chances (EC) of above-, near-, and below-normal
temperatures are indicated over the Northern Plains and northeastern Alaska.

For the SON Precipitation Outlook, below-normal precipitation is favored for
the Central Great Basin and Southwest into the Central and Southern Plains, and
parts of the Middle Mississippi, Ohio, Tennessee, and Lower Mississippi Valley
regions. Above-normal precipitation is favored over western Alaska, the Pacific
Northwest, and the coastal Southeast.

Elsewhere over the U.S., EC is forecast where probabilities for each category
of seasonal mean temperatures and seasonal accumulated precipitation amounts
are expected to be similar to climatological probabilities.

BASIS AND SUMMARY OF THE CURRENT LONG-LEAD OUTLOOKS
Note: For Graphical Displays of the Forecast Tools Discussed Below See:
http://www.cpc.ncep.noaa.gov/products/predictions/90day/tools/briefing

CURRENT ATMOSPHERIC AND OCEANIC CONDITIONS

Over the past four weeks, equatorial SSTs have been above-average in the
eastern and far western tropical Pacific Ocean, with near-to-below-average SSTs
over the more central parts of the tropical Pacific Ocean. SST departures in
the Niño3.4 region reached -0.3 degrees Celsius over the last week.
Below-average sub-surface temperature departures have strengthened in the
east-central and eastern Pacific in recent months. The coupled ocean-atmosphere
system reflects ENSO-neutral conditions. Though we are under a La Niña Watch
and SSTs have been trending slightly cooler in the Niño3.4 region, ENSO-neutral
conditions are currently present, thus any influence of the cooler SSTs comes
into play for late fall and winter 2025-2026.

As for local impacts, local SSTs are above-average in the Gulf of Alaska, along
the Southeast and East coasts of the CONUS, and along the West Coast with the
exception of Southern California which is more neutral. Local interaction
between soil moisture and temperature and precipitation is less of a player as
we move into the fall. Still, below-average soil moisture is present over much
of the western U.S., the Middle and Lower Mississippi Valley, New England, and
Florida, with scattered regions of above-average soil moisture over e.g. the
Mid-Atlantic, the Upper Mississippi Valley, and the Northern and Central
Plains. Local interactions with soil moisture and SSTs are considered for early
leads where applicable and relevant.

PROGNOSTIC DISCUSSION OF SST FORECASTS

The North American Multi-Model Ensemble (NMME) favors a short-lived La Niña
during late fall and early winter 2025. In contrast, predictions from the
International Research Institute (IRI) favor ENSO-neutral to persist through
winter 2025-2026. Given the recent trend of below-average tropical Pacific SSTs
along with NMME forecasts, chances of La Niña are narrowly favored for winter
2025-2026. In general, ENSO-neutral is most likely through the late Northern
Hemisphere summer 2025 (56% chance in August-September-October, ASO).
Thereafter, a brief period of weak La Niña conditions is favored in the fall
and early winter 2025-26 before reverting to ENSO-neutral.

PROGNOSTIC TOOLS USED FOR U.S. TEMPERATURE AND PRECIPITATION OUTLOOKS

Dynamical model forecasts from the NMME, the Coupled Forecast System Model
Version 2 (CFSv2), and the Copernicus (C3S) multi-model ensemble system were
used extensively for the first six leads when they are available, as was the
objective, historical skill weighted consolidation and Calibration, Bridging,
and Merging (CBaM) guidance, that combines both dynamical and statistical
forecast information. A consolidation of statistical tools including the
ENSO-OCN tool, which represents the combined influence of ENSO (when active)
and decadal timescale trends  in temperature and precipitation (utilizing the
Optimum Climate Normal, OCN) and dynamical models  is used for the first six
leads. Following this, the ENSO-OCN forecast tool is used more extensively.
Decadal variability and trends  are determined from the OCN, representing the
difference between the most recent 15-year period average seasonal temperature
or precipitation and the average for the climatology period, from 1991-2020.

PROGNOSTIC DISCUSSION OF OUTLOOKS - SON 2025 TO SON 2026

TEMPERATURE

Above-normal temperatures are favored for much of the CONUS and Alaska for SON
2025. Probabilities are enhanced over the Four Corners and Southwest, reaching
60 to 70 percent chances of above-normal temperatures. This is due to agreement
among NMME and C3S, presence of below-average soil moisture and a below-normal
precipitation forecast, and above-normal decadal temperature trends , which all
act to increase confidence in the forecast for this region. This area of
above-normal temperature probabilities is shifted southward and more confident
than last month, owing to differences in dynamical model forecasts from last
month to this month and increased confidence. In contrast, models show
decreased certainty over the Northwest and Northern Plains, possibly due to
cooler temperatures from the North and a tendency for below-normal temperatures
during potential La Niña events as winter approaches. However, given the weak
and short-lived nature of the potential La Niña, only weak teleconnections are
expected.

Probabilities for above-normal temperatures are also enhanced, reaching 60 to
70 percent, over the Northeast where there was agreement among tools, decadal
trends are above-normal, and above-normal surrounding SSTs. Similar arguments
apply to Florida, where there is a 50 to 60 percent chance of above-normal
temperatures, but comparatively weaker as chances of above-normal precipitation
may offer some cooler periods during the season. While above-normal
temperatures are still favored for the West Coast, probabilities are increased
from 33 to 40 percent to 40 to 50 percent over much of California due to
climatology which indicates the potential for warmer fall temperatures over
parts of California. However, we may see a slight moderation of temperatures
along the southern coast given the presence of neutral to weakly below-average
SSTs and coastal sea breezes. Similarly over the interior Southeast and
Mid-Atlantic, probabilities are slightly increased from last month given lack
of above-average soil moisture, and a weak tilt toward below-normal
precipitation.

Above-normal temperatures are broadly favored over the CONUS through
November-December-January (NDJ) 2025-2026, with EC over the northern tier where
uncertainty is higher. Some La Niña-like impacts or weak teleconnections to the
cooler forecasted SSTs may begin to appear in December-January-February (DJF)
2025-2026 through February-March-April (FMA) 2026, namely a weak tilt toward
below-normal temperatures over the Pacific Northwest in DJF and
January-February-March (JFM) 2026, transitioning to weak but more widespread
below-normal temperature probabilities over the northern tier by FMA 2026. This
is juxtaposed with above-normal temperatures over the Southwest, southern tier,
and East Coast. Longer-term forecasts, from April-May-June (AMJ) 2026 through
SON 2026, depict an expansion of above-normal temperatures that will eventually
cover most of the lower 48 states by SON 2026. These longer lead forecasts are
primarily based on decadal trends .

Confidence over Alaska is comparatively less than the lower 48 at most leads.
The forecast for Alaska remains similar to last month’s SON forecast, however,
a weak tilt toward above-normal now stretches across much of the state as
indicated by above-normal temperature trends . The strongest probabilities (50
to 60 percent) are over the Northwest where decadal trends  are strongest.
Moving through the remainder of the forecast period, above-normal temperatures
are generally favored over parts of Alaska, though the potential for weak La
Niña teleconnections leading to a weak tilt toward below-normal temperatures
over the Southeast are possible during winter months.


PRECIPITATION

The SON 2025 Precipitation Outlook favors below-normal precipitation from the
southern parts of the Northern Great Basin and Northern Rockies to the
Southwest, and into parts of the Middle and Lower Mississippi Valley, Ohio, and
Tennessee Valley regions. This Outlook shifts the below-normal probabilities
southward from last month and places higher probabilities (40 to 50 percent)
over parts of the Four Corners, Central, and Southern Plains. This region of
below-normal precipitation is co-located with the areas of above-normal
temperatures and below-average soil moisture. Probabilities are weaker over
southern Arizona and New Mexico due to the potential storminess in September
due to the forecast active hurricane season.

The below-normal precipitation forecast extends eastward to the Tennessee
Valley, aligning with model predictions, decadal trends , and a lack of
above-average soil moisture. Above-normal precipitation is indicated over the
Pacific Northwest, favored by the C3S model and potential La Niña-like impacts
as we approach November. Though models in NMME and C3S did not show a coherent
precipitation signal over the Southeast, the forecast for an above-normal
Atlantic hurricane season and climatology leads to a tilt toward above-normal
precipitation.

As we shift into fall and winter 2025 and 2026, above-normal precipitation is
favored over the Northwest and North Central CONUS, and over the Great Lakes
stretching to the northern Gulf States. In contrast, below-normal precipitation
is favored over the southern tier of the CONUS. This pattern resembles a La
Niña teleconnection, but the pattern has low confidence due to the uncertainty,
short-lived nature, and weakness of the potential event. From March-April-May
(MAM) 2026 through SON2026, decadal trends  in precipitation are increasingly
relied upon to create the forecasts.

Forecasts of precipitation over Alaska are comparatively more uncertain with
large areas of 33 to 40 percent chances of above-normal precipitation or EC for
many of the seasons. A slight tilt toward above-normal precipitation is
indicated for the western coast of Alaska in SON2025 given C3S and decadal
trends. Per the Monthly Precipitation Outlook, the season may start out with
above-normal precipitation over the Southeast in September, but this becomes
more uncertain as the season progresses and EC is indicated for the season as a
whole. The region of above-normal precipitation expands across the state
through JFM2026 before shifting back to the Northwest. Much of this pattern is
based on the presence of decadal trends  in precipitation over Alaska, due to
weak and inconsistent model forecasts.

FORECASTER: Johnna Infanti